Math Kangaroo 2025 Statistics
Table 1.0 Statistical distribution of scores in 2025.
Max points to earn | GRADE | PARTICIPATION | Mean (score) | Median (score) | Mode (score) | Standard Deviation (score) | Min (score) | Max (score) |
96 | 1 | 5899 | 49.56 | 48 | 40 | 18.67 | 0 | 96 |
96 | 2 | 8273 | 62.99 | 64 | 91 | 18.27 | 0 | 96 |
96 | 3 | 9094 | 57.80 | 58 | 91 | 19.21 | 0 | 96 |
96 | 4 | 9101 | 66.52 | 69 | 91 | 18.37 | 0 | 96 |
120 | 5 | 8115 | 65.01 | 64 | 63 | 23.89 | 0 | 120 |
120 | 6 | 4878 | 74.25 | 75 | 115 | 24.71 | 0 | 120 |
120 | 7 | 3602 | 70.28 | 70 | 83 | 21.91 | 0 | 120 |
120 | 8 | 2387 | 76.62 | 77 | 120 | 23.17 | 20 | 120 |
120 | 9 | 1074 | 65.59 | 66 | 73 | 24.07 | 7 | 120 |
120 | 10 | 576 | 68.06 | 68 | 57 | 25.85 | 9 | 120 |
120 | 11 | 410 | 71.05 | 69.5 | 68 | 25.85 | 12 | 120 |
120 | 12 | 153 | 76.57 | 74 | 115 | 27.88 | 10 | 120 |
Table 1.1 Number of participants in the last ten years.
Table 1.2 Number of participants per grade in 2025.
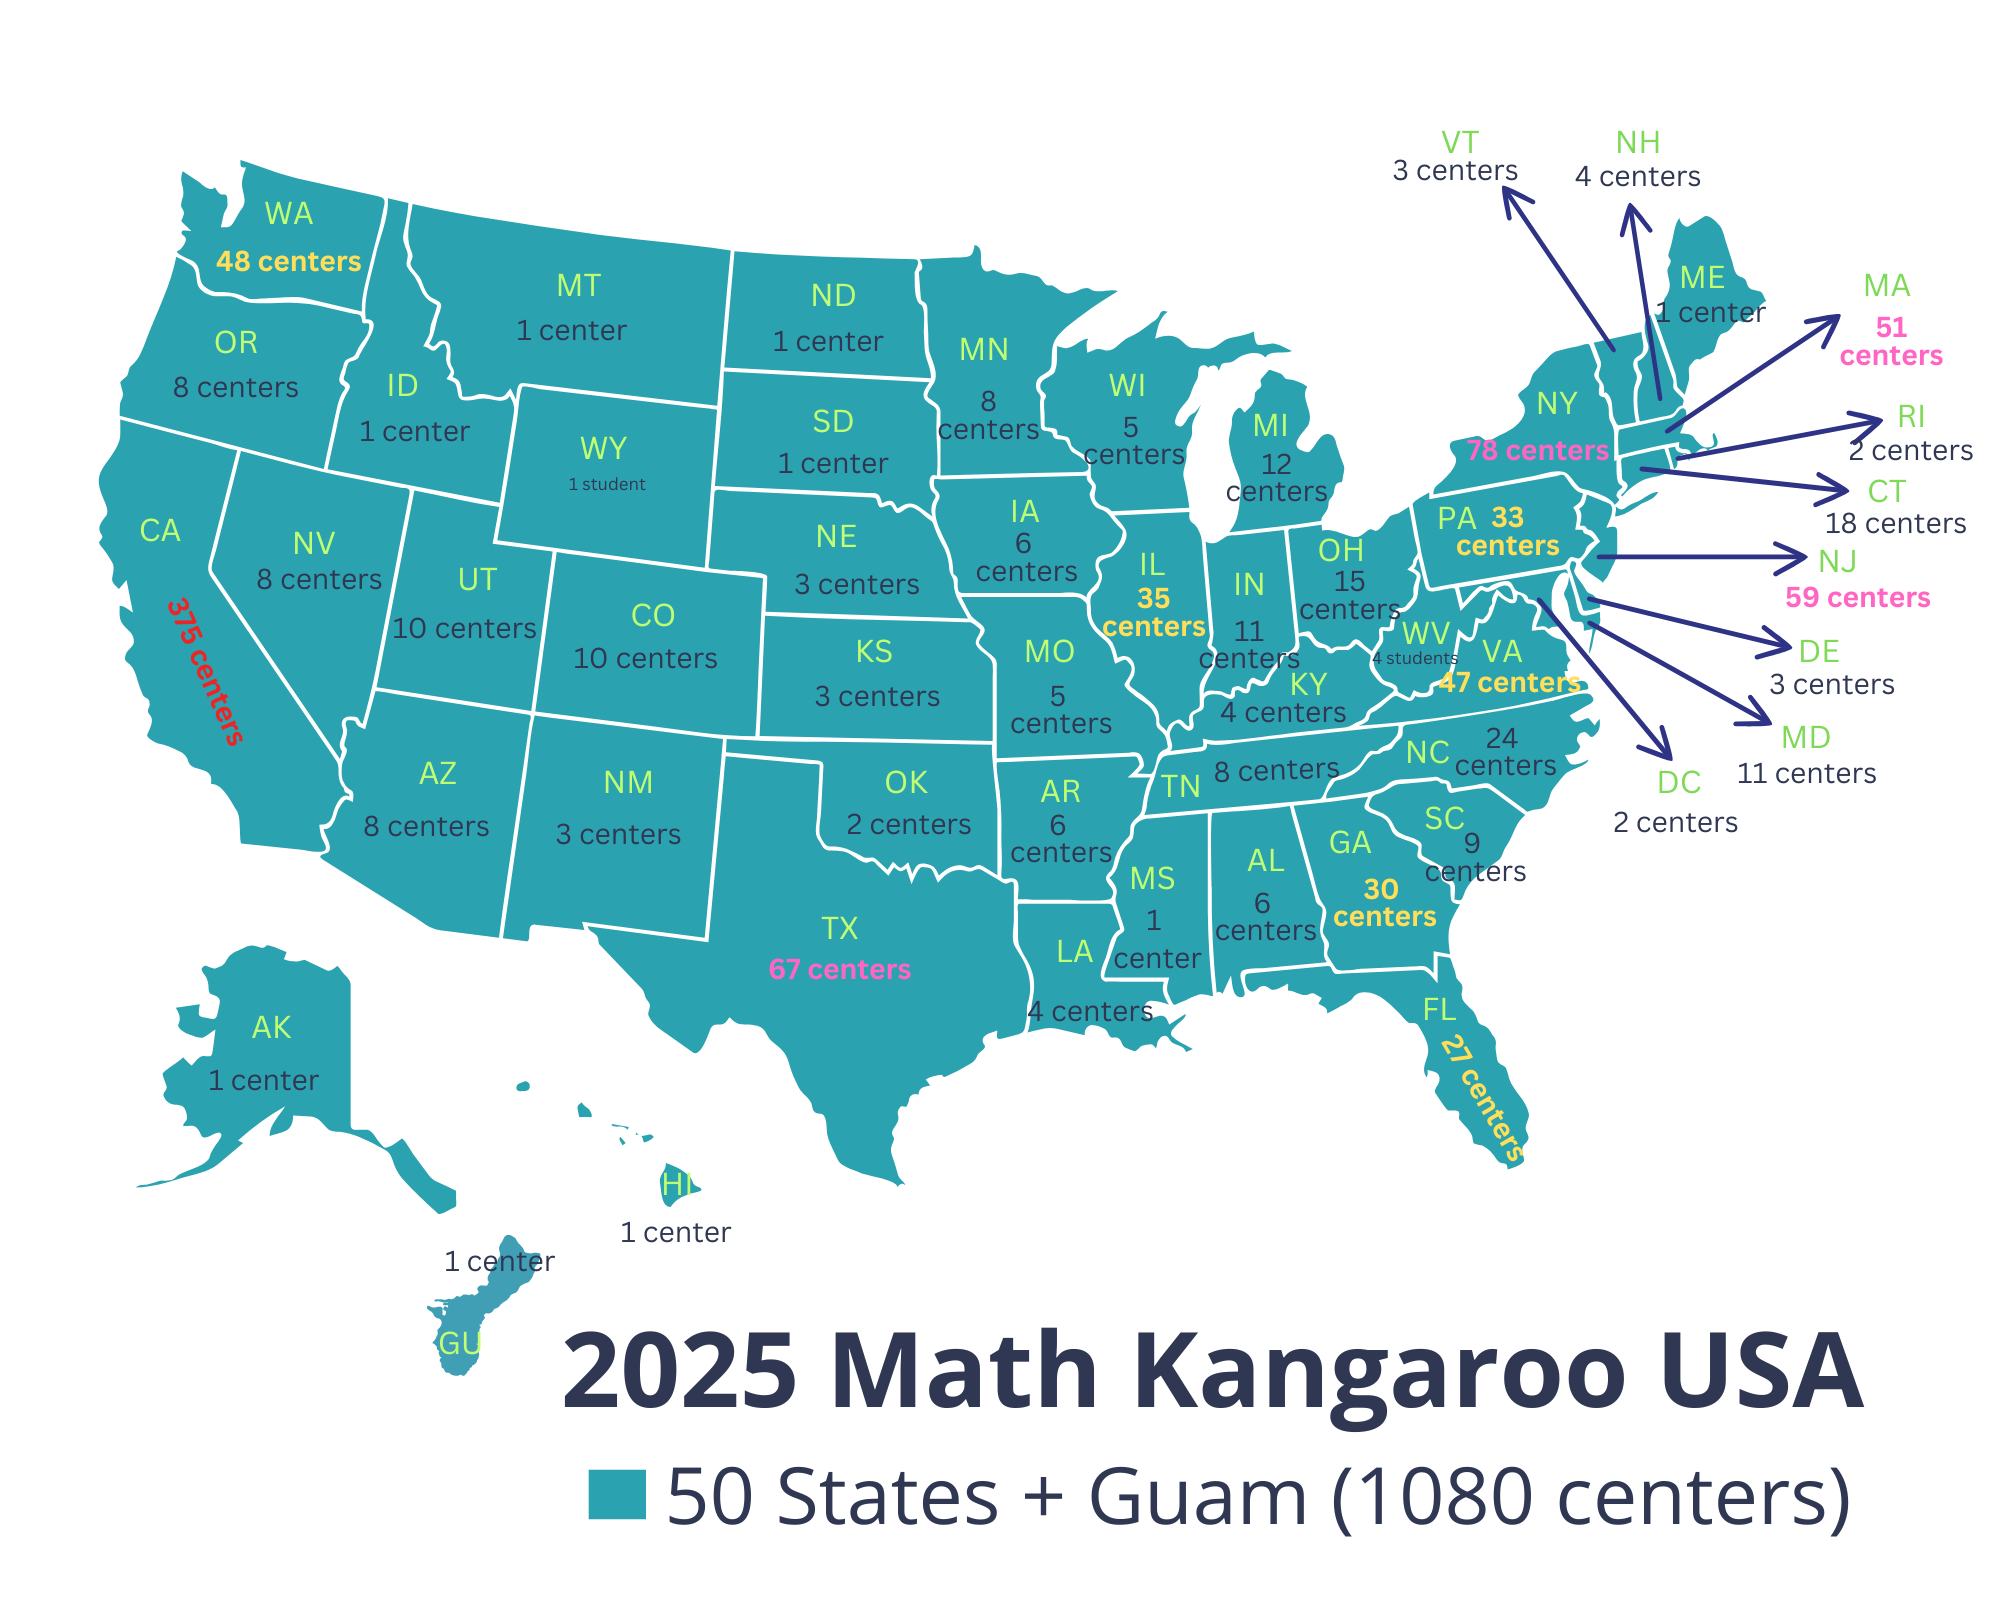
Table 1.3 Number of participants per state in 2025.
Table 1.4 Number of centers in the last five years.
Table 1.5 Participating states in 2025.

Table 1.6 Number of state participants per grade in 2025.
Grade 1 | Grade 2 | Grade 3 | Grade 4 | Grade 5 | Grade 6 | Grade 7 | Grade 8 | Grade 9 | Grade 10 | Grade 11 | Grade 12 | TOTAL | |
AK | 3 | 1 | 1 | 0 | 1 | 1 | 1 | 1 | 0 | 1 | 0 | 0 | 10 |
AL | 5 | 5 | 5 | 23 | 16 | 58 | 32 | 17 | 12 | 19 | 11 | 7 | 210 |
AR | 20 | 20 | 20 | 30 | 23 | 26 | 13 | 12 | 8 | 3 | 2 | 1 | 178 |
AZ | 14 | 26 | 23 | 27 | 20 | 18 | 15 | 10 | 7 | 3 | 2 | 2 | 167 |
CA | 2596 | 3598 | 3680 | 3705 | 3307 | 1801 | 1235 | 821 | 314 | 157 | 88 | 21 | 21323 |
CO | 33 | 53 | 63 | 51 | 50 | 29 | 11 | 13 | 6 | 2 | 1 | 0 | 312 |
CT | 51 | 99 | 145 | 122 | 144 | 125 | 117 | 59 | 38 | 8 | 5 | 6 | 919 |
DC | 25 | 21 | 17 | 18 | 5 | 2 | 0 | 0 | 0 | 0 | 0 | 0 | 88 |
DE | 8 | 18 | 22 | 15 | 11 | 12 | 15 | 6 | 5 | 1 | 1 | 0 | 114 |
FL | 51 | 88 | 80 | 85 | 85 | 72 | 42 | 38 | 17 | 8 | 2 | 3 | 571 |
GA | 305 | 360 | 395 | 375 | 370 | 109 | 102 | 67 | 14 | 12 | 12 | 5 | 2126 |
GU | 3 | 5 | 14 | 13 | 25 | 0 | 0 | 0 | 0 | 0 | 2 | 0 | 62 |
HI | 0 | 0 | 3 | 1 | 3 | 1 | 0 | 0 | 0 | 0 | 0 | 0 | 8 |
IA | 8 | 20 | 16 | 16 | 13 | 13 | 31 | 16 | 3 | 1 | 3 | 0 | 140 |
ID | 0 | 2 | 0 | 4 | 2 | 1 | 2 | 0 | 0 | 0 | 0 | 0 | 11 |
IL | 126 | 230 | 271 | 338 | 244 | 170 | 108 | 81 | 33 | 18 | 15 | 7 | 1641 |
IN | 26 | 42 | 45 | 46 | 38 | 21 | 27 | 19 | 4 | 4 | 1 | 2 | 275 |
KS | 12 | 19 | 23 | 20 | 21 | 8 | 11 | 7 | 5 | 2 | 2 | 2 | 132 |
KY | 13 | 12 | 25 | 22 | 22 | 15 | 14 | 3 | 7 | 3 | 3 | 0 | 139 |
LA | 25 | 28 | 11 | 21 | 19 | 12 | 5 | 4 | 2 | 4 | 6 | 3 | 140 |
MA | 277 | 415 | 484 | 526 | 487 | 402 | 327 | 251 | 114 | 61 | 25 | 12 | 3381 |
MD | 60 | 88 | 88 | 113 | 87 | 54 | 42 | 41 | 21 | 8 | 7 | 2 | 611 |
ME | 0 | 5 | 2 | 2 | 6 | 0 | 0 | 2 | 0 | 0 | 0 | 0 | 17 |
MI | 41 | 90 | 99 | 85 | 80 | 46 | 35 | 29 | 20 | 5 | 4 | 2 | 536 |
MN | 18 | 23 | 47 | 49 | 45 | 21 | 12 | 10 | 3 | 3 | 1 | 0 | 232 |
MO | 39 | 15 | 14 | 14 | 13 | 3 | 3 | 1 | 1 | 1 | 0 | 0 | 104 |
MS | 1 | 1 | 1 | 0 | 1 | 0 | 2 | 2 | 0 | 0 | 1 | 0 | 9 |
MT | 1 | 2 | 2 | 0 | 2 | 6 | 1 | 1 | 0 | 1 | 0 | 0 | 16 |
NC | 93 | 125 | 162 | 177 | 146 | 110 | 87 | 35 | 35 | 23 | 11 | 2 | 1006 |
ND | 6 | 9 | 8 | 2 | 7 | 0 | 0 | 0 | 0 | 0 | 0 | 0 | 32 |
NE | 8 | 14 | 19 | 17 | 18 | 12 | 12 | 6 | 0 | 1 | 0 | 1 | 108 |
NH | 11 | 13 | 20 | 30 | 22 | 18 | 26 | 14 | 12 | 4 | 3 | 2 | 175 |
NJ | 282 | 354 | 456 | 396 | 266 | 206 | 206 | 137 | 78 | 33 | 39 | 10 | 2743 |
NM | 5 | 6 | 6 | 11 | 6 | 6 | 2 | 1 | 0 | 0 | 0 | 0 | 43 |
NV | 40 | 46 | 45 | 47 | 43 | 86 | 52 | 44 | 1 | 4 | 7 | 0 | 415 |
NY | 338 | 466 | 604 | 586 | 462 | 311 | 212 | 112 | 75 | 27 | 34 | 9 | 3236 |
OH | 30 | 33 | 42 | 65 | 58 | 25 | 25 | 19 | 8 | 7 | 11 | 4 | 327 |
OK | 5 | 13 | 10 | 9 | 8 | 7 | 8 | 3 | 3 | 1 | 2 | 0 | 69 |
OR | 36 | 68 | 74 | 56 | 48 | 35 | 19 | 9 | 10 | 5 | 3 | 0 | 363 |
PA | 98 | 190 | 252 | 240 | 209 | 110 | 71 | 33 | 24 | 14 | 9 | 6 | 1256 |
RI | 6 | 7 | 15 | 18 | 14 | 8 | 13 | 7 | 4 | 1 | 1 | 0 | 94 |
SC | 19 | 36 | 44 | 51 | 59 | 16 | 9 | 16 | 3 | 2 | 2 | 0 | 257 |
SD | 1 | 1 | 1 | 2 | 1 | 3 | 2 | 2 | 0 | 0 | 0 | 0 | 13 |
TN | 9 | 17 | 21 | 21 | 21 | 17 | 17 | 18 | 9 | 6 | 6 | 3 | 165 |
TX | 367 | 507 | 527 | 584 | 402 | 286 | 233 | 160 | 60 | 42 | 27 | 14 | 3209 |
UT | 43 | 34 | 87 | 43 | 36 | 30 | 24 | 14 | 8 | 8 | 8 | 3 | 338 |
VA | 252 | 362 | 401 | 348 | 360 | 201 | 126 | 84 | 44 | 22 | 27 | 14 | 2241 |
VT | 13 | 10 | 9 | 12 | 7 | 5 | 5 | 3 | 1 | 1 | 0 | 0 | 66 |
WA | 366 | 532 | 566 | 513 | 434 | 212 | 167 | 107 | 37 | 23 | 11 | 6 | 2974 |
WI | 10 | 13 | 19 | 13 | 36 | 10 | 7 | 6 | 3 | 6 | 0 | 1 | 124 |
Virtual | 100 | 131 | 110 | 139 | 92 | 78 | 76 | 46 | 25 | 21 | 15 | 3 | 836 |
TOTAL | 5899 | 8273 | 9094 | 9101 | 8115 | 4878 | 3602 | 2387 | 1074 | 576 | 410 | 153 | 53562 |


